Which industries are booming...and those busting?
The Australian Bureau of Statistics (ABS) publishes a high-quality data series titled the Monthly Business Turnover Indicator. These statistics offer insight into the short-term movements in economic activity across selected industries.
Derived from Business Activity Statement (BAS) data submitted to the Australian Taxation Office (ATO), the series tracks monthly changes in business turnover across a dozen industry groupings, including retail, construction, manufacturing, and accommodation. Although it does not cover all sectors (such as banking and finance), it provides a high-frequency indicator of how different parts of the economy are performing from month to month.
This information is particularly useful for business executives seeking to understand which industries are experiencing materially higher sales volumes or are undergoing contraction.
The chart below is an excerpt from a dataset maintained by Benchmark Analytics, based largely on ABS data but supplemented with other sources, including political overlays. For example, we can rapidly determine the turnover rate of specific industries during the tenure of government ministers with formal responsibility for regulating those industries. This is especially valuable for advocacy and media work.
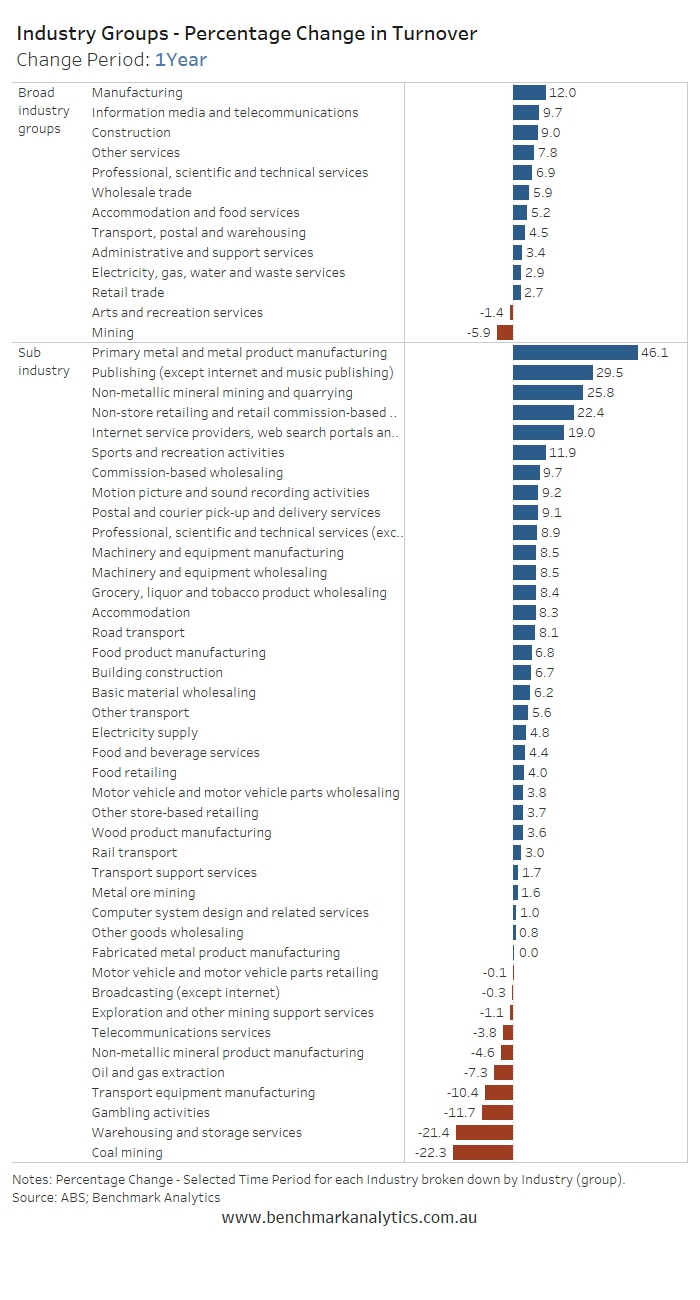
For the purposes of this post, I have selected a turnover period covering the twelve months to March 2025. It shows some surprising results—most notably, the fastest turnover growth has occurred in the manufacturing sector. In just one year, turnover has grown by 12% (adjusted for structural changes). The chart also provides insight into the sub-industries within broader sectors. Within manufacturing, the fastest-growing sub-industry is primary metal and metal product manufacturing, where turnover has increased by 46.1% over the year. In contrast, turnover in the mining sector has declined by 5.9%, with the sharpest fall recorded in coal mining.
Notes on the use of Index for time series analysis
To present the data consistently, the ABS uses an index format rather than raw dollar figures. This allows for a more meaningful comparison over time. The base year for the index is set at 100 (currently June 2019), and each subsequent month’s data shows how turnover has changed relative to that benchmark. For instance, an index value of 115 in a given month would mean turnover has risen by 15% since the base period. This method neutralises the effect of differing absolute sizes between industries and focuses attention on growth dynamics rather than scale.
One of the main strengths of using an index is that it facilitates comparison across vastly different industry types. Retail and mining, for example, operate on different scales and respond to different economic drivers. By using an index, analysts and policymakers can observe relative performance—identifying which industries are expanding more rapidly, recovering more slowly, or declining in the wake of economic shocks. The monthly frequency also enables early detection of turning points in business activity that might not yet appear in quarterly or annual GDP figures.
For businesses, investors, and public officials, the Monthly Business Turnover Indicator serves as a useful barometer of sector-specific momentum. It is particularly valuable in periods of rapid change—such as post-pandemic recovery or during inflationary cycles—when traditional measures like GDP or employment may lag. Although the data is experimental and subject to revision, its timeliness and consistency make it one of the most useful tools available for tracking short-term economic trends across Australia's diverse industry base.