Is he really Captain Chaos?
Data alert | The VIX 'Fear Index' since Trump's tariff Liberation Day
The most widely cited metric for measuring economic fear is the VIX—short for Volatility Index. It tracks expected volatility in the US stock market, specifically the S&P 500, which represents the 500 largest publicly listed companies.
The VIX is calculated using a formula based on option prices. Options are financial contracts that give the holder the right (but not the obligation) to buy or sell a stock at a specific price within a set time frame—typically 30 days. For example, if Tesla shares are trading at $200, an option to sell Tesla at $195 within the next month isn’t worth much. Why would anyone pay for the right to sell something at a lower price?
The answer: fear. If investors suddenly believe Tesla shares might plunge to $150, that $195 sell option becomes highly valuable. Investors will bid up the price of such an option—perhaps from $2 to $30—as a form of insurance. The more fear in the market, the higher the price of options. That’s the concept behind the VIX: rising option prices signal rising fear.
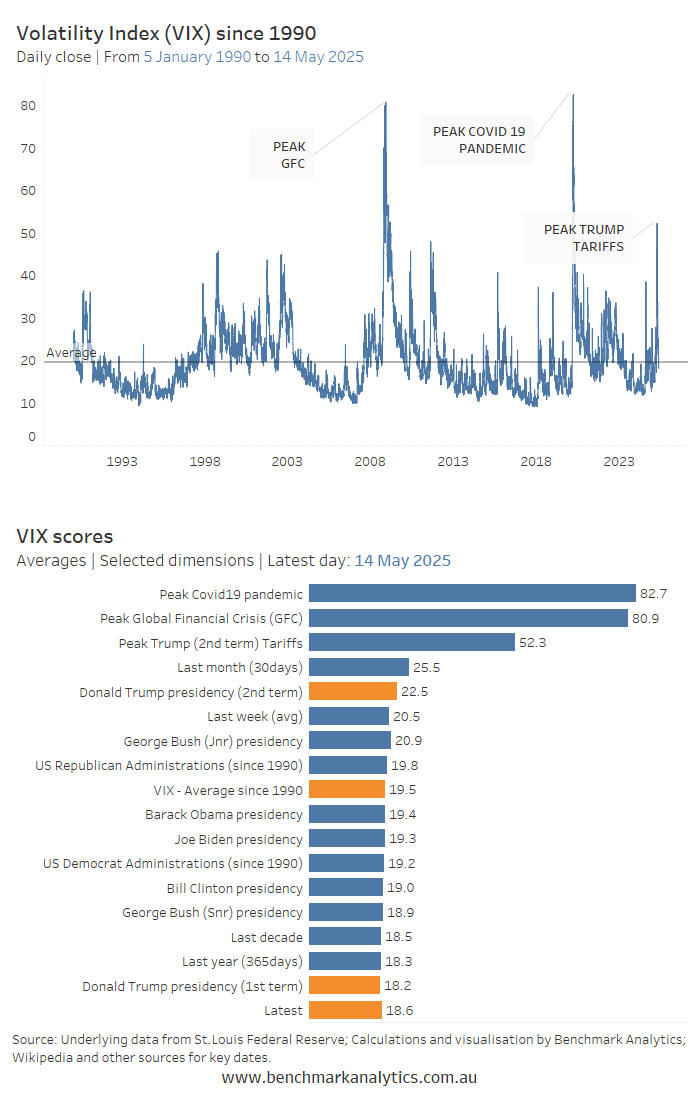
The VIX became widely known during the 2008 Global Financial Crisis (GFC), when it spiked to unprecedented levels.
Data since 1990 show there have been three occasions when the VIX has surged above 50. The first was during the GFC, when it peaked at 80.9. The second came during the COVID-19 panic, when it reached 82.7. A third spike occurred when Donald Trump announced his “Liberation Day” tariffs, driving the VIX to 52.3.
Trump has a reputation for rattling markets with his unpredictability. But ironically, during his first term (2016–2020), market volatility remained low. The average VIX level under Trump was 18.2, the lowest of any president since 1990. By comparison, under President George W. Bush, the VIX averaged 20.9. The long-term average since 1990 is 19.5.
As of 14 May 2025, the VIX sits at a calm 18.6, meaning the market now believes Trump's tariff regime is largely benign in terms of financial risk.
Further plain English explanation of the Vix from Chat GPT:
If you’ve ever seen headlines declaring that the "VIX is spiking" or that the "Fear Index is rising," you might have wondered what exactly this mysterious number is and why it matters. The VIX—short for the Volatility Index—is one of the most watched measures of stress in global financial markets. But how is it calculated? What does it actually measure? And why should policymakers, investors, or economists pay attention to it?
What Is the VIX?
The VIX is a market index published by the Chicago Board Options Exchange (CBOE). It measures the expected volatility of the U.S. stock market over the next 30 days. More specifically, it tracks investor sentiment about the S&P 500 index, which is the benchmark for large U.S. companies.
In essence, the VIX is a real-time indicator of fear, uncertainty, and risk in financial markets. When investors expect turbulent times ahead, the VIX rises. When they are calm and confident, it falls.
How Is the VIX Constructed?
The VIX is not based on stock prices, but rather on options—specifically, S&P 500 index options. These are contracts that give investors the right (but not the obligation) to buy or sell the S&P 500 at a certain price in the future.
Here’s a simple breakdown of the logic:
Options prices reflect expectations of future volatility.
If markets are expected to swing wildly, options become more expensive, because they are more likely to be profitable. If things are expected to stay quiet, options are cheaper.
The VIX uses these option prices to infer volatility.
The index looks at a wide range of out-of-the-money options (those not profitable right now) that expire in about 30 days. It uses a mathematical formula to combine these prices into a single number: the implied volatility.
This number is expressed as an annualised percentage.
For example, if the VIX is at 20, it means that investors expect the S&P 500 to move up or down by about 20% over the next year (or about 5.8% over the next month, assuming normal statistical distribution).
So: higher VIX = higher expected volatility.
What Makes the VIX Move?
The VIX reacts to shifts in sentiment, uncertainty, and risk appetite. Common triggers include:
Market corrections or crashes (e.g., March 2020 COVID panic)
Political uncertainty (e.g., U.S. elections, Brexit votes)
Global crises (e.g., wars, banking instability, debt ceiling drama)
On average, the VIX ranges between 15 and 20 in normal market conditions. Readings above 30 suggest high levels of fear, while readings above 40 or 50 usually occur during crises.
Why Is the VIX Valuable?
The VIX serves as a financial seismograph—it doesn’t tell you exactly what will happen, but it indicates when the ground beneath markets is starting to shake.
Its uses include:
Investor sentiment gauge.
Policymakers and analysts often use it as a high-frequency indicator of market psychology. A sudden spike can signal a sharp loss of confidence.
Risk management tool.
Portfolio managers track the VIX to adjust their asset allocations. When the VIX is high, many shift to safer assets or hedge their exposure.
Cross-asset signal.
Movements in the VIX are often correlated with other key metrics—such as credit spreads, currency volatility, or gold prices.
Derivatives benchmark.
There are now financial products that allow investors to trade the VIX itself—such as VIX futures and ETFs—allowing speculation or hedging on future volatility.
Final Thoughts: More Than Just a Number
The VIX is not a perfect predictor of market outcomes—but it’s among the best real-time indicators of market stress. It captures expectations, not certainties. It is forward-looking, not explanatory.
If you’re running a business, managing investments, or trying to understand market psychology, keeping one eye on the VIX is worthwhile. Just like a barometer tells you that a storm might be coming, the VIX can alert you when financial weather conditions are starting to turn.