Home building approvals decline in latest month
Data Alert | Building Approvals for March 2025
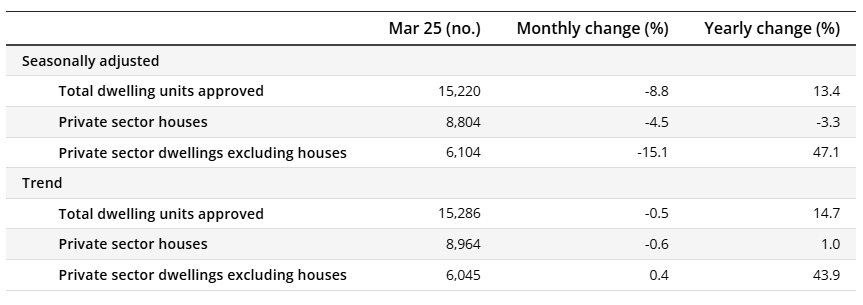
The total number of dwellings approved fell 8.8 per cent in March, to 15,220 - based on seasonally adjusted data. However, over the year to March 25, approvals are up 13.4%. Declines were seen across all dwelling types in March with unit approvals down 15.1 per cent, and private sector houses 4.5 per cent lower.
As a percentage of total dwellings approved, the number of units approved accounted for was 40.1%, this is less than the long-term average of about 43.9%.
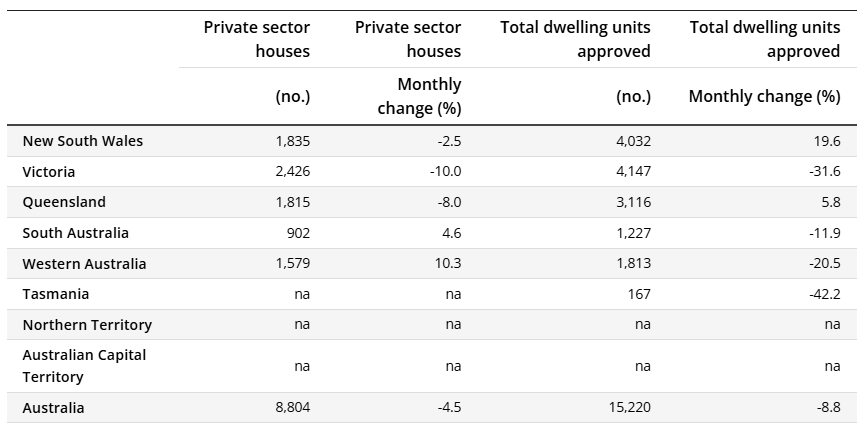
On a state-wide basis (see chart below), total unit approvals in Tasmania declined 42% over the month. In Victoria, a far more significant market, unit approvals fell 31.6% in the month. They increased by 19.6% in Victoria.
Building Approvals - What the data is used for
- Monthly Building Approvals provide a forward-looking indicator of construction activity, offering early insights into future trends in residential and non-residential building work.
- Because construction is a labour-intensive sector, changes in building approvals have direct implications for employment, subcontractor demand, and related service industries.
- The data helps economists and policymakers gauge the impact of interest rate changes, as approvals typically respond to shifts in financing costs and consumer sentiment.
- Sharp rises or falls in approvals can signal turning points in the housing cycle, which often precedes broader movements in the economy due to the multiplier effects of housing investment.
- Regional variations in building approvals shed light on population shifts, infrastructure bottlenecks, and the differential impact of housing policy across jurisdictions.
- Investors and developers use the statistics to assess market conditions, identify demand-supply mismatches, and inform decisions on timing and scale of new projects.
Building approvals at a State level, Seasonally Adjusted data