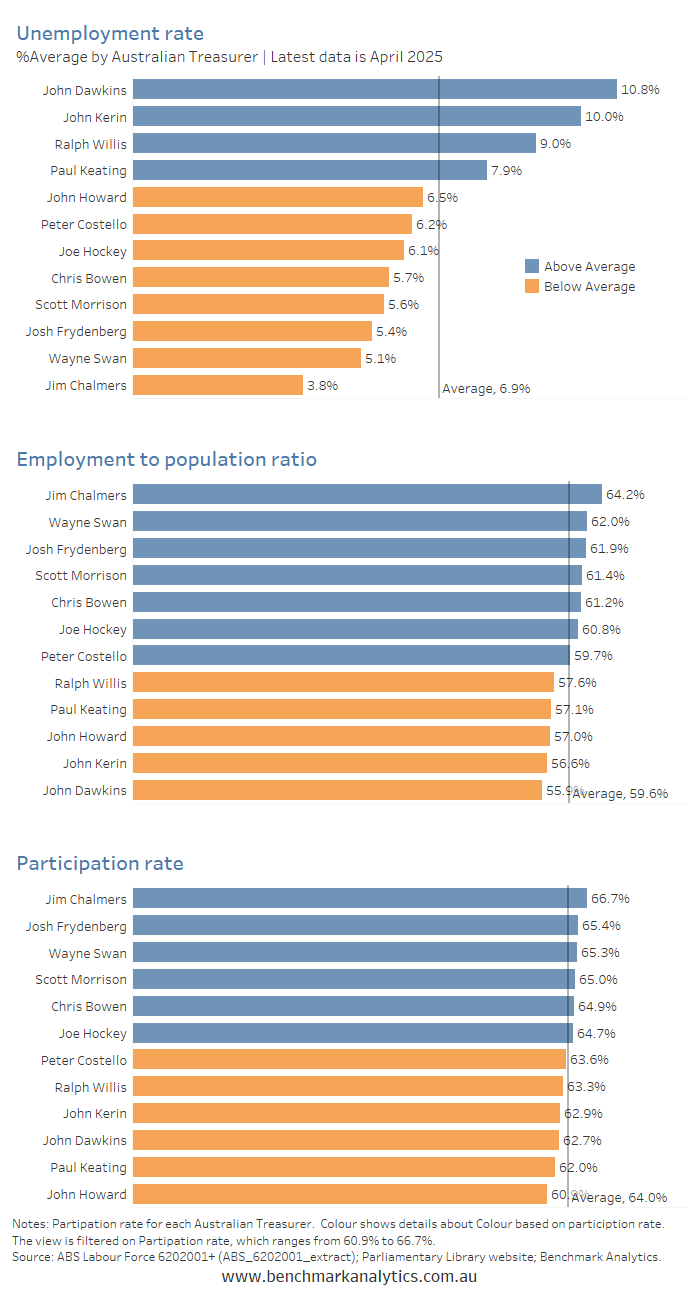
Australian Treasurers - Ranked by three key labour force metrics
Data Alert | ABS Labour Force released
Key figures
In seasonally adjusted terms, in April 2025:
- Unemployment rate remained at 4.1%.
- Participation rate increased to 67.1%.
- Employment increased to 14,642,700.
- Employment to population ratio increased to 64.4%.
- Underemployment rate increased to 6.0%.
- Monthly hours worked increased to 1,964 million.
- Full-time employment increased by 59,500 to 10,074,300 people.
- Part-time employment increased by 29,500 to 4,568,400 people.
Strong jobs growth means there is less chance the RBA will cut interest rates at the next meeting, although a cut is still more likely than not. The labour market is very healthy.
Political dimension - comparing performance of Treasurers
The monthly ABS Labour Force statistics were released today. While the data is widely reported in the media, it is rarely put into an historic political context.
The following three charts present key labour market indicators for Australian Commonwealth Treasurers, beginning in 1978—the year when high-quality labour market data first became available.
The figures show that Treasurer Jim Chalmers has overseen something of a dream labour market. Average unemployment rates during his tenure have been lower than under any other Treasurer.
An important but often overlooked metric is the employment-to-population ratio. This measures the health of the labour force and the extent to which an economy’s key resource—labour—is being utilised. On this measure, the average ratio under Chalmers has been 64.2, well above the long-term average of 59.6%.
Another significant indicator is the participation rate, which shows the proportion of the working age population (15years+) that is either employed or actively seeking work. Once again, it has averaged higher under Chalmers—66.7%—than under any other Treasurer.
It is important to note, however, that a low average unemployment rate does not necessarily indicate that a Treasurer implemented successful economic reforms to bring about favourable outcomes. The benefits of good policy often take years to materialise. For example, Bob Hawke and Paul Keating were reformist leaders, yet labour market outcomes were generally poor during their tenures in the 1980s.
Even so, politicians themselves will attribute these metric outcomes to the tenures of their opponents, so they are relevant for political analysis and contemporary debate.
Additional notes on the definition and importance of the three labour market metrics cited in this post
Unemployment Rate
The unemployment rate is defined as the percentage of people in the labour force who are actively seeking work but are unable to find it. The labour force includes individuals aged 15 and over who are either employed or unemployed (i.e. not working but available and actively looking for work). The rate is calculated by dividing the number of unemployed people by the total labour force and multiplying the result by 100.
This rate is one of the most closely watched economic indicators because it reflects the degree of underutilisation of labour in the economy. A high unemployment rate suggests spare capacity in the labour market, potentially indicating economic slack or downturn. Conversely, a low unemployment rate can signal a tight labour market, which may place upward pressure on wages and inflation if demand for workers exceeds supply.
However, the unemployment rate has limitations. It excludes discouraged job seekers who have stopped looking for work and thus are no longer counted in the labour force. It also does not differentiate between full-time and part-time employment or account for underemployment. Therefore, while the unemployment rate provides important insights, it is most useful when interpreted alongside other indicators like the participation rate and underemployment rate.
Participation Rate
The participation rate measures the proportion of the working-age population (typically aged 15 and over) that is either employed or actively seeking employment. It is calculated by dividing the labour force by the total working-age population and multiplying by 100. This indicator reflects the willingness and ability of people to engage with the labour market.
The participation rate is crucial for understanding broader trends in labour supply and potential economic output. For instance, an increasing participation rate may signal growing optimism about job prospects, especially among groups like women, older workers, or younger people entering the workforce. It can also reflect structural shifts such as rising education levels or changes to retirement patterns.
A falling participation rate can be problematic, particularly if it reflects long-term disengagement from the labour market due to discouragement or demographic trends such as ageing. Policymakers monitor the participation rate closely because it affects the size of the labour force and therefore the economy’s productive capacity. It is also key to interpreting changes in the unemployment rate—since a falling unemployment rate, in the context of a falling participation rate, may not indicate an improving labour market.
Employment-to-Population Ratio
The employment-to-population ratio measures the proportion of the working-age population that is currently employed. It is calculated by dividing the number of employed persons by the total working-age population and multiplying by 100. Unlike the unemployment rate, this metric is not affected by whether someone is actively seeking work, making it a broader measure of labour market engagement.
This ratio is particularly useful for assessing the economy’s capacity to generate jobs over time, especially when population growth is rapid or when participation rates are shifting. A rising employment-to-population ratio usually signals improving economic conditions and higher household incomes, while a declining ratio may reflect economic weakness, demographic ageing, or a loss of confidence in the job market.
Because it includes all working-age people, regardless of whether they are in the labour force, the employment-to-population ratio is often viewed as a more stable long-term indicator of labour market health. It is valuable in international comparisons and for assessing the full employment potential of an economy. Policymakers and analysts use it alongside the participation and unemployment rates to form a more complete picture of labour market performance.